Rate and Performance Benchmarking
For High-Stakes Regulated Industries

In industries where supply chain integrity is non-negotiable, Quantix Managed Solutions provides the data-driven clarity needed to lead. We turn disparate market data into actionable benchmarks, allowing Chemical and Pharmaceutical leaders to stabilize costs, mitigate volatility, and optimize lanes across all modes – road, rail, ocean, air and Courier, Express and Parcel (CEP).
Implementation in days – not months.

Real Impact, Measured
- The average identified saving opportunity for participants, based on total spend, was 8.3%
- 2.2% OTD increase vs. the market for subscription participants
- Average benchmark coverage of 93.8%
- 100% of participants identified savings, even if they outperformed the market
The High Price of Status Quo
| Challenge | Chemical Industry | Pharmaceutical Industry |
|---|---|---|
| Operational Efficiency | 15% increase in logistics expenses for companies relying on manual processes. | 68% of knowledge workers rely on manual processes; only 32% use integrated systems. |
| Visibility & Risk | 94% lack full visibility, creating crippling blind spots in the end-to-end chain | Potential cost of $100M – $600M per major product recall due to lack of centralized risk views. |
| Financial Performance | Up to 10% loss in annual revenue due to inability to benchmark and optimize providers. | Up to 10% loss in annual revenue due to the inability to benchmark and optimize providers. |
| Critical Industry Risk | $37.5M in damages in 2025 alone from non-compliance with hazardous material regulations. | $35B annual loss resulting specifically from temperature excursions in regulated shipments. |
Why Quantix for Benchmarking?
Six benefits purpose-built for high-stakes regulated industries.
Cost Transparency
See exactly how your freight rates compare to market norms for chemical-specific requirements and modes.
Negotiation Leverage
Back carrier discussions with reliable benchmark data. No more gut feeling.
Mode Optimization
Spot opportunities to shift between bulk truck, intermodal, rail, and more – understand lead time and OTD impact.
Budget Accuracy
Ground forecasts in real market averages and volatility trends for dependable budgeting.
Supplier Performance Insight
Identify lanes or carriers trending above benchmark for compliance and allocation decisions.
Strategic Planning & Continuous Improvement
Inform portfolio, network designs, and contract decisions to align execution with strategy. Track measurable logistics KPIs year-over-year to drive sustained efficiency.
Coverage by Mode & Region
From lane-level rates to service KPIs across your global network.
North America, Europe (EMEA), APAC, LATAM
Road Freight
- Full Truck Load (FTL)
- LTL/ Groupage
- Chemical Liquid Bulk
- Dry Bulk
- Intermodal
- Drayage
Rail
- North American Rail
Global
- Ocean Full Container Load
- Ocean ISO Tanks
- Air Freight
- Courier, Express and Parcel (CEP)
What We Benchmark
Performance & rates for chemicals – tailored to your lanes and requirements.
- 30+ KPIs across cost & service
- Carrier compliance & allocation
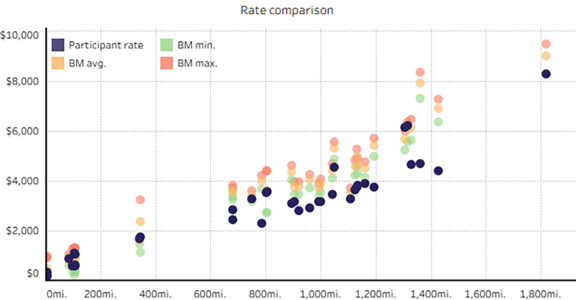
- Lane-level rate comparisons
- Volatility & budget-to-actuals
- Lead times & OTD analysis
Benchmark Report Examples
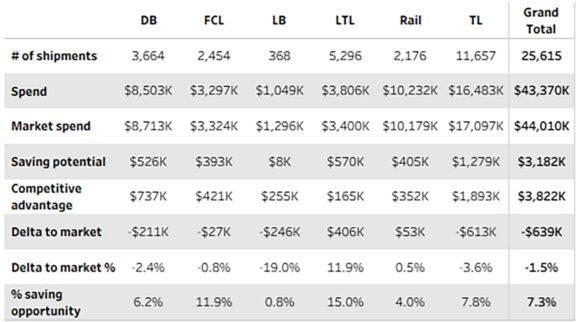
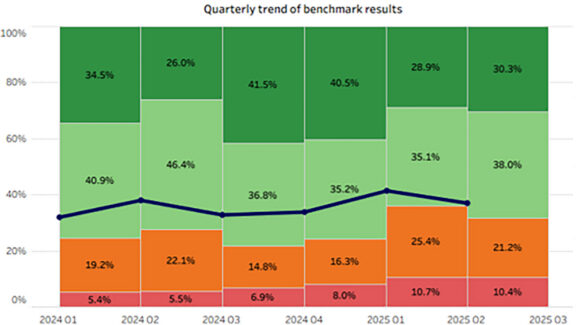
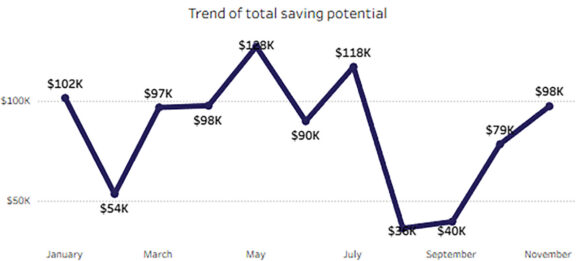
Transportation strategy as an ongoing process
Timing is key to outperform. Move from insights to outcomes – then monitor to stay on track.
1. Historical Data & Trend Analysis
Ingest your shipment history to baseline costs, service and volatility.
2. Benchmark
Compare performance and rates against the market for your exact chemical requirements and lanes.
3. Strategy Implementation
Translate insights into sourcing, allocation, and mode-shift actions.
4. Monitoring
Dashboards and alerts track deviations and sustain improvements.

Ready to benchmark your supply chain?
Request a live demo and sample report tailored to your lanes.